For a Part-145 repair station, data is never the problem. Work orders, purchase orders, invoices, customer records: the information exists. The challenge is turning it into something a manager can actually use to make decisions.
That is what MRO data reporting is designed to solve. In this article, we walk through the five Power BI reports built into Smart 145 that give MRO managers real visibility into their operations, from delivery performance and procurement control to financial results and customer intelligence.
What Is MRO Data Reporting and What Does It Mean for Business Management?
MRO data reporting is the process of collecting, organizing, and visualizing operational data from a maintenance, repair, and overhaul operation to support business decisions. In a Part-145 repair station, this means turning information from work orders, purchase orders, invoices, and customer records into structured reports that management can read and act on.
Structure is what makes data useful. A manager who is aware that TAT is due this month has important information. A manager who can see which work order types are driving that increase, and how it is affecting revenue, has something they can act on.
Effective MRO data reporting does three things for business management: it reduces reaction time by surfacing problems before they become crises, it connects operational decisions to financial outcomes, and it gives every department a common, objective reference point.
The five reports below cover the areas where that clarity matters most.
Report 1: Work Order TAT - The Report That Controls Delivery Performance
Turnaround time is the metric every MRO customer watches. When a work order closes late, it affects aircraft availability, customer trust, and contractual obligations. For repair stations certified under 14 CFR Part 145, managing TAT is both a regulatory and a commercial priority.

-
How TAT Data Translates into Customer Reliability and Revenue Protection
A repair station that delivers consistently on time builds a reputation that generates repeat business. The problem is that TAT issues rarely announce themselves early. By the time a manager notices a pattern, multiple work orders have already been affected. Tracking TAT by work order type, customer, and status allows managers to intervene before delays reach the customer.
-
Work Order TAT Tracking: Identifying Delays Before They Become Business Problems
TAT tracking at the work order level reveals exactly where the process slows down. Common bottlenecks include parts waiting time, inspection queues, and approval stages. IATA identifies these stages as the leading causes of TAT overruns across Part-145 repair stations. This is the practical value of work order TAT tracking: visibility that makes intervention possible before delays compound.
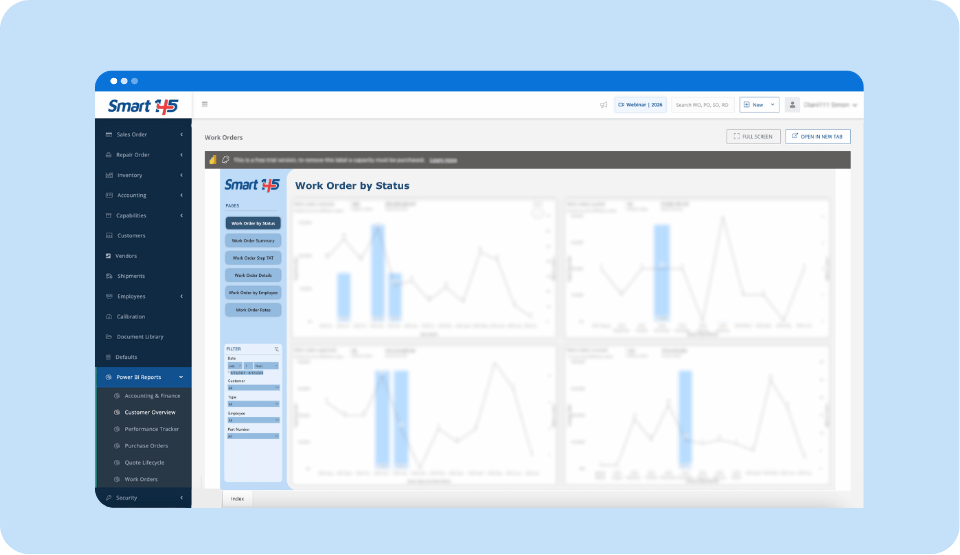
In Smart 145: the Work Orders report tracks every work order through four visible stages: received, quoted, approved, and invoiced. Each stage shows order count and total price, so managers know exactly where work is sitting and what revenue is at stake.
The Work Order Step TAT page offers deeper insight. It tracks time spent at each step of the repair process and can be filtered by customer, type, employee, or part number. When a recurring delay pattern shows up, management has the data to address it directly before the customer calls.
Report 2: Purchase Control - The Report Behind Procurement and Cash Flow Decisions
A delayed part stops a work order. A stopped work order drives up TAT, affecting the customer and ultimately impacting revenue. Procurement problems never stay in the procurement department. That is why purchase order visibility is a business management issue, not just an operations one.
-
How Purchase Order Data Reduces Unplanned Work Order Delays
Parts availability is one of the main drivers of TAT performance. When a work order stalls because a part has not arrived, the delay is visible at the operations level, but its root cause sits in procurement. Tracking purchase orders by status, required date, and completion date connects the two. Managers can see which orders are still open, which are partially received, and how long each one has been in transit.
When average PO time is tracked consistently, procurement performance becomes measurable. A vendor with a 5-day average PO time and one with a 12-day average represent very different risks for work order scheduling.
-
Open Orders, Pending Deliveries, and the Hidden Cost of Poor Procurement Visibility
Every open purchase order represents a financial commitment and an operational dependency. Without visibility into the open PO value and expected delivery dates, managers cannot schedule work orders accurately. The gap between POs processed and POs completed in any given month is a direct indicator of procurement backlog. When that gap widens, work order delays typically follow.
Oliver Wyman's MRO survey consistently ranks parts availability as one of the top operational challenges for independent repair stations. Structured MRO data reporting for procurement is one of the most direct ways to reduce that exposure.
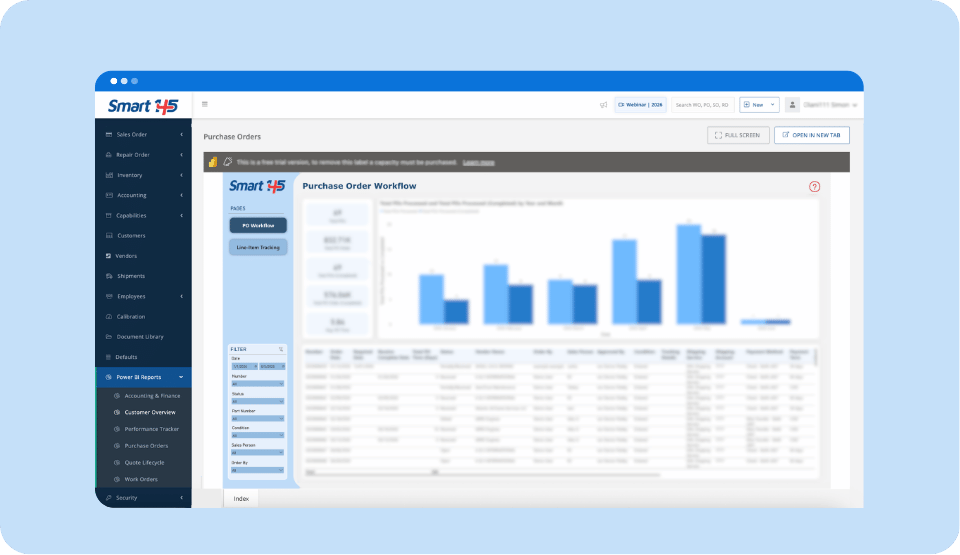
In Smart 145: the Purchase Orders report shows the total number of POs, completed POs, and average PO time at a glance. The PO Workflow page tracks every order by status — open, received, or partially received — with the vendor name, required date, shipping details, and payment terms in a single table.
The Line-Item Tracking page goes deeper, allowing managers to drill down into individual line items across multiple POs. When a part is late, management can identify the vendor, the order date, and the impact on active work orders without leaving the report.
Report 3: Operational Performance - The Report That Shows Business Health in Real Time
Most MRO managers start their day with the same question: where does the business stand right now? The answer usually requires pulling data from multiple sources and waiting for someone to compile it. The Performance Tracker eliminates that process.
-
MRO KPI Metrics by Year, Quarter, Month, and Day: What Changes When You Can See Everything
Most management decisions are made with incomplete information. A manager reviewing monthly numbers may miss a weekly pattern. A manager focused on daily activity may lose sight of quarterly trends.
Having KPI data across all four time dimensions simultaneously changes how decisions get made. Daily figures show what needs attention today. MTD and QTD show whether the business is on track to meet targets. YTD provides the strategic context behind both.
When all four are visible at once, across every key metric, the business stops being a series of isolated data points. It becomes something a manager can actually read and act on.
-
Using Your Aviation Maintenance Dashboard to Track Work Order Volume and Revenue Trends
An MRO operation generates multiple transaction types simultaneously: sales orders, vendor quotes, customer quotes, purchase orders, and invoices. Tracked in isolation, each tells a partial story.
When count, cost, and price are visible across all of them simultaneously, the relationship between operational activity and financial results becomes clear. Revenue trends reveal whether the business is growing or contracting. Customer profitability data shows which accounts deserve priority attention.
AP and AR status-by-order-type flags cash-flow risks before they become cash-flow problems. According to Oliver Wyman's 2025 MRO survey, receivables management is one of the leading financial risks for independent Part-145 repair stations. That level of visibility is what separates reactive management from planned management.
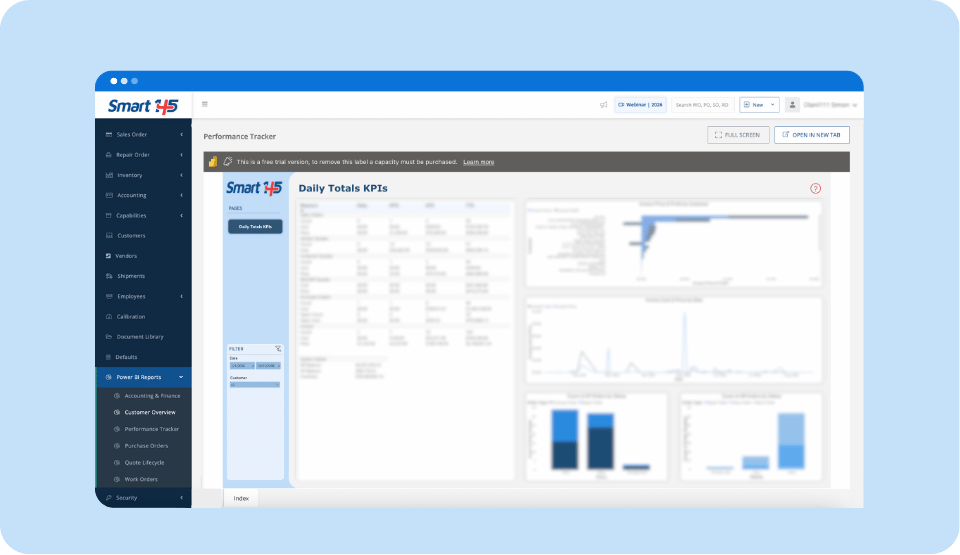
In Smart 145: the Performance Tracker shows all of this on a single page. The Daily Totals KPIs table breaks down every transaction type across daily, MTD, QTD, and YTD periods. Below it, three system values give an instant financial health check: current AR balance, AP balance, and total inventory value.
The charts on the right show invoice price and profit by customer, cost and price trends over time, and AP/AR order status at a glance. In practice, it serves as an aviation maintenance dashboard, integrating operational and financial data into a single real-time view.
Report 4: Customer Intelligence - The Report That Connects Operations to Revenue
Not all customers represent the same value to a repair station. Some generate high volume with low margin. Others generate low volume with high margin. Without data, managers treat them the same. Customer intelligence changes that.
-
How Customer Data Reveals Which Relationships Actually Drive Profitability
Revenue concentration is one of the most undermonitored risks in MRO operations. When a significant portion of total revenue comes from a small number of customers, the business carries exposure that daily operations rarely make visible.
Tracking revenue by customer alongside workload distribution shows the real picture. A customer that generates 40% of revenue but consumes 60% of operational capacity may be far less profitable than the headline numbers suggest. Knowing which customers drive margin, not just volume, allows management to prioritize relationships and negotiate contracts from a position of data rather than assumption.
-
Aviation Business Intelligence: From Customer Behavior to Smarter Business Decisions
Customer activity traceability connects order history to invoice status for every account. When a customer's order frequency drops or payment patterns shift, management can identify the trend early and respond before it becomes a financial risk.
New customer tracking adds another layer. Knowing what percentage of the customer base is new in any period gives a direct read on business development performance and growth trajectory. IATA's global MRO forecast identifies customer retention as a key driver of revenue stability for Part-145 operators. The data to manage it already exists in the system. The report makes it visible.
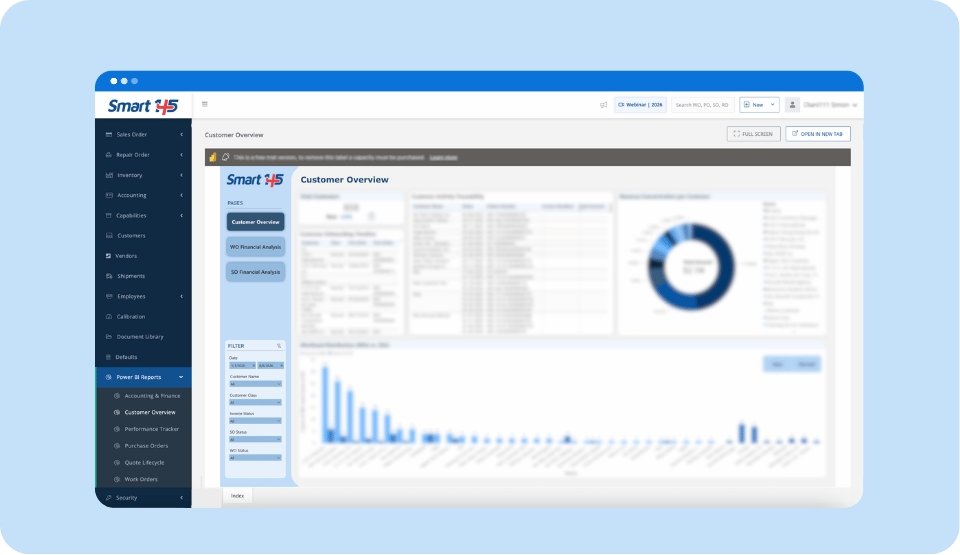
In Smart 145: the Customer Overview gives managers a full picture of the customer base with activity traceability across every order and invoice. The revenue concentration chart shows the percentage breakdown of total revenue by customer account, making it immediately clear how dependent the business is on its top relationships.
The workload distribution chart maps work orders and sales orders by customer, showing which accounts drive the most operational activity. The WO and SO Financial Analysis pages go deeper, breaking down financial performance per customer across both work order and sales order activity. When revenue concentration and workload data are read together, management has what it needs to decide which relationships to grow, protect, or renegotiate.
Report 5: Financial Performance - The Report That Closes the Loop Between Operations and Profit
Every decision made in a repair station has a financial consequence. TAT performance affects invoice value. Procurement delays affect cost. Customer mix affects margin. Effective MRO data reporting at the financial level is what closes the loop between what the operation does and what it earns.
-
MRO KPI Metrics That Bridge Execution and Business Performance
Financial performance in MRO goes beyond whether invoices are paid. It is about understanding whether what the operation does is translating into what it earns.
Tracking total invoice value, cost, and profit margin over time shows whether operational improvements are producing financial results. A repair station that improves TAT but sees margin decline has a cost problem that operations data alone would not reveal.
Year-over-year trend data adds context. A single strong month may reflect seasonal demand rather than sustained growth. Comparing profit percentages across years shows whether the business is building financial health or trading volume for margin.
-
Spotting Revenue Leakage Before It Hits Your Bottom Line
Revenue leakage in MRO typically shows up in three places: uninvoiced work, partially paid invoices, and work orders that close below quoted price. Each one represents money earned operationally but not captured financially.
Tracking invoice status across the customer base makes these gaps visible. When open invoice value is high relative to total revenue, collections management becomes a priority before it affects cash flow. PwC's Aviation Finance Outlook identifies billing accuracy and invoice cycle time as leading contributors to revenue leakage in MRO operations.
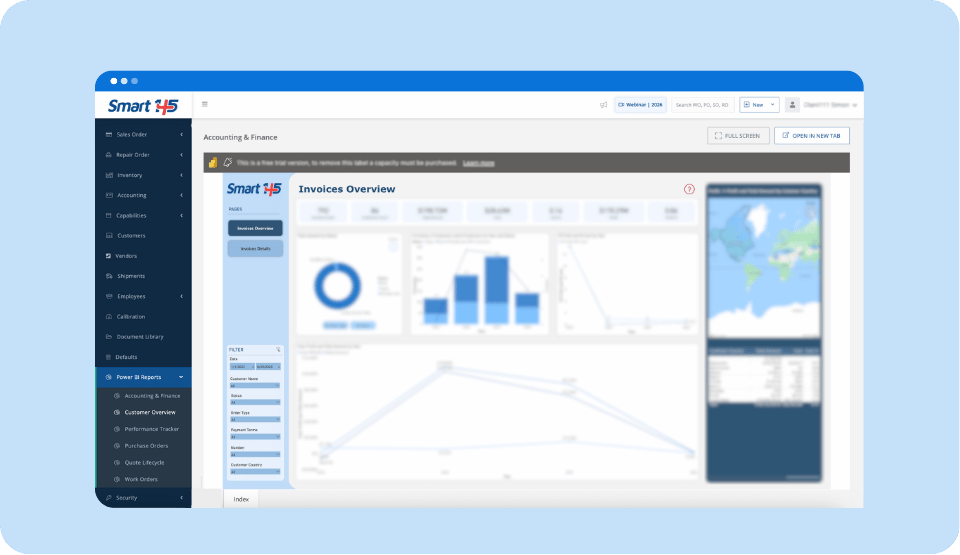
In Smart 145, the Accounting & Finance report provides managers with a consolidated view of invoice performance across the entire customer base. Total amount, cost, and profit are visible in a single overview, with invoice status broken down by paid, open, and partially paid.
Multi-year trend data shows whether margins are holding or under pressure over time. The geographic breakdown by customer country adds context for repair stations serving international accounts. Reviewed together, these views give management a clear and current read on the financial health of the operation.
What MRO KPI Metrics Give Managers the Most Business Decision Power?
Based on the five reports above, these are the metrics with the highest impact on day-to-day management decisions in a Part-145 repair station:
- Work order TAT by type and customer. The most direct indicator of delivery performance and customer reliability. When it moves, everything else follows.
- Average PO time and open PO value. The earliest warning signal for work order delays before they reach the operation floor.
- Daily, MTD, QTD, and YTD transaction volumes. The operational pulse that tells management whether the business is on track or drifting across every key activity.
- Revenue concentration by customer. The strategic risk metric most repair stations under-monitor until it becomes a problem.
- Invoice profit margin and open invoice status. The financial health check that connects operational activity to actual earnings.
Tracked together on a Power BI aviation dashboard, these metrics give management a complete and current picture of the business in a single view.
How Smart 145 Connects Your MRO Data to Power BI, and What Changes When It Does
The five reports in this article are only useful when the data behind them is accurate, up to date, and connected to the systems where MRO work actually happens. That is the core requirement for any MRO reporting software: real integration with the ERP, not manual exports or scheduled data pulls.

-
What to Look for in MRO Reporting Software Before You Build Any Dashboard
A Power BI maintenance dashboard is only as reliable as its data source. Before building any report, managers should confirm that the reporting tool connects directly to the ERP system in real time. Scheduled exports create gaps. A report built on yesterday's data may not reflect a work order that closed this morning or a purchase order that arrived this afternoon.
Native integration eliminates that risk. It also removes the administrative overhead of maintaining export files and the human error that comes with them.
-
From Aviation KPI Dashboard to Real Business Decisions: What Actually Changes
A manager who relies on spreadsheets and manual reports spends time compiling data. A manager working from a live aviation KPI dashboard spends that time making decisions. The shift is about confidence. When managers know the data is current and complete, they act on it. When they are not sure, they wait for confirmation or second-guess what they see.
For any repair station building toward a Power BI maintenance dashboard, the prerequisite is data that is already structured, current, and integrated. No exports, no manual updates, no lag between what happens in the operation and what appears in the report.
That is what MRO data reporting is designed to deliver. And it is where the business control this article describes actually begins.
Ready to see it in action? Smart 145 includes all five Power BI reports natively, connected directly to your ERP data in real time. Request a demo and see how your repair station's data looks on a live dashboard.